* 겪고 있는 문제 상황을 최대한 자세하게 작성해주세요.
* 문제 해결을 위해 어떤 시도를 해보았는지 구체적으로 함께 알려주세요.
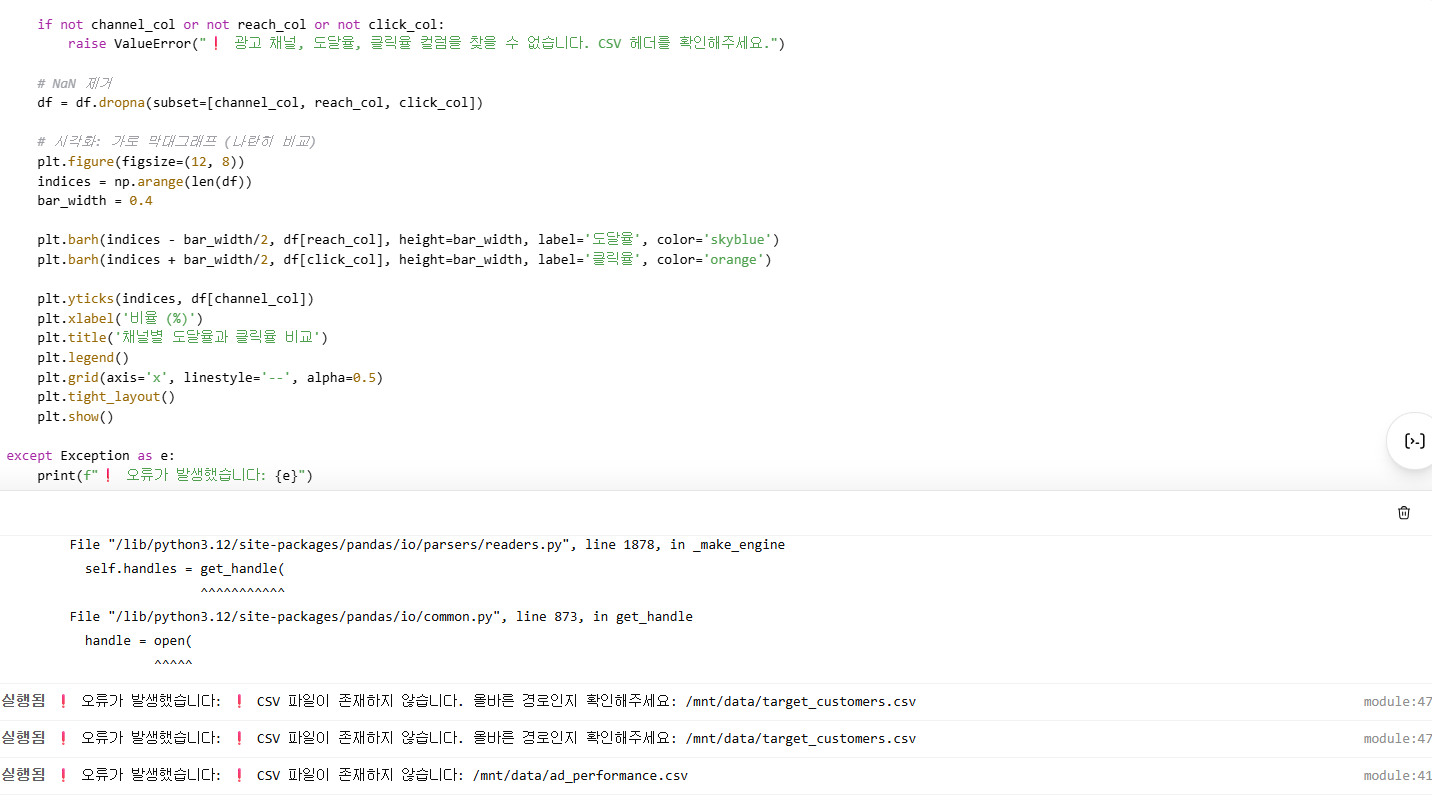
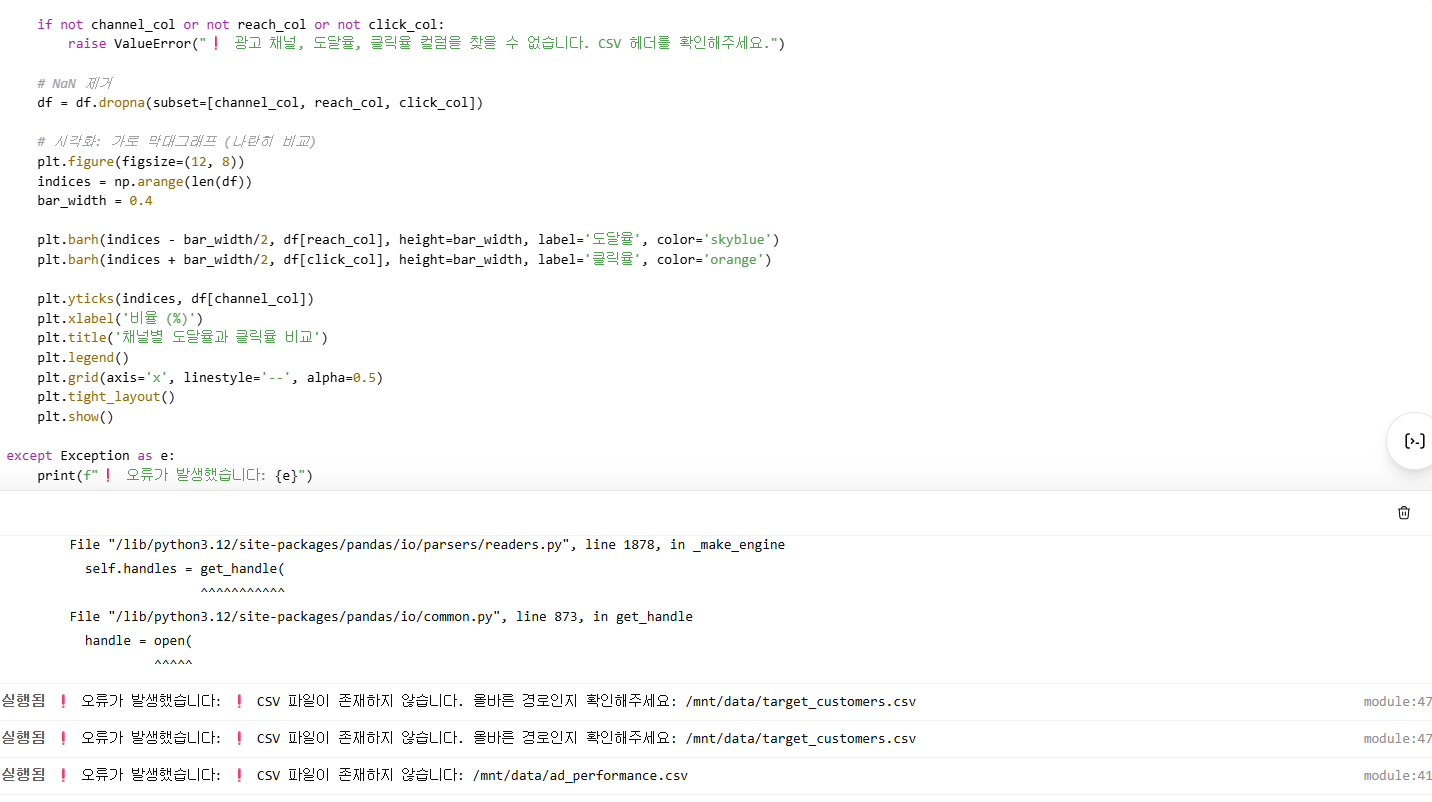
프로 버전인데 기획서 딸깍 끝내기 1,2 아무리 똑같이 몇번을 해도 같은 답 안나와요. word파일 생성 안되고, 코드 생성도 오류나고요
import pandas as pd
import os
import matplotlib.pyplot as plt
import numpy as np
# 최신 CSV 경로
ad_file = '/mnt/data/ad_performance.csv'
try:
if not os.path.exists(ad_file):
raise FileNotFoundError(f"❗ CSV 파일이 존재하지 않습니다: {ad_file}")
df = pd.read_csv(ad_file)
if df.empty:
raise ValueError("❗ CSV 파일이 비어 있습니다.")
print("컬럼명:", df.columns.tolist())
print(df.head())
# 광고 채널, 도달율, 클릭율 컬럼 식별
channel_col = next((col for col in df.columns if '채널' in col or 'channel' in col.lower()), None)
reach_col = next((col for col in df.columns if '도달' in col or 'reach' in col.lower()), None)
click_col = next((col for col in df.columns if '클릭' in col or 'click' in col.lower()), None)
if not channel_col or not reach_col or not click_col:
raise ValueError("❗ 광고 채널, 도달율, 클릭율 컬럼을 찾을 수 없습니다. CSV 헤더를 확인해주세요.")
# NaN 제거
df = df.dropna(subset=[channel_col, reach_col, click_col])
# 시각화: 가로 막대그래프 (나란히 비교)
plt.figure(figsize=(12, 8))
indices = np.arange(len(df))
bar_width = 0.4
plt.barh(indices - bar_width/2, df[reach_col], height=bar_width, label='도달율', color='skyblue')
plt.barh(indices + bar_width/2, df[click_col], height=bar_width, label='클릭율', color='orange')
plt.yticks(indices, df[channel_col])
plt.xlabel('비율 (%)')
plt.title('채널별 도달율과 클릭율 비교')
plt.legend()
plt.grid(axis='x', linestyle='--', alpha=0.5)
plt.tight_layout()
plt.show()
except Exception as e:
print(f"❗ 오류가 발생했습니다: {e}")