


* 겪고 있는 문제 상황을 최대한 자세하게 작성해주세요.
* 문제 해결을 위해 어떤 시도를 해보았는지 구체적으로 함께 알려주세요.
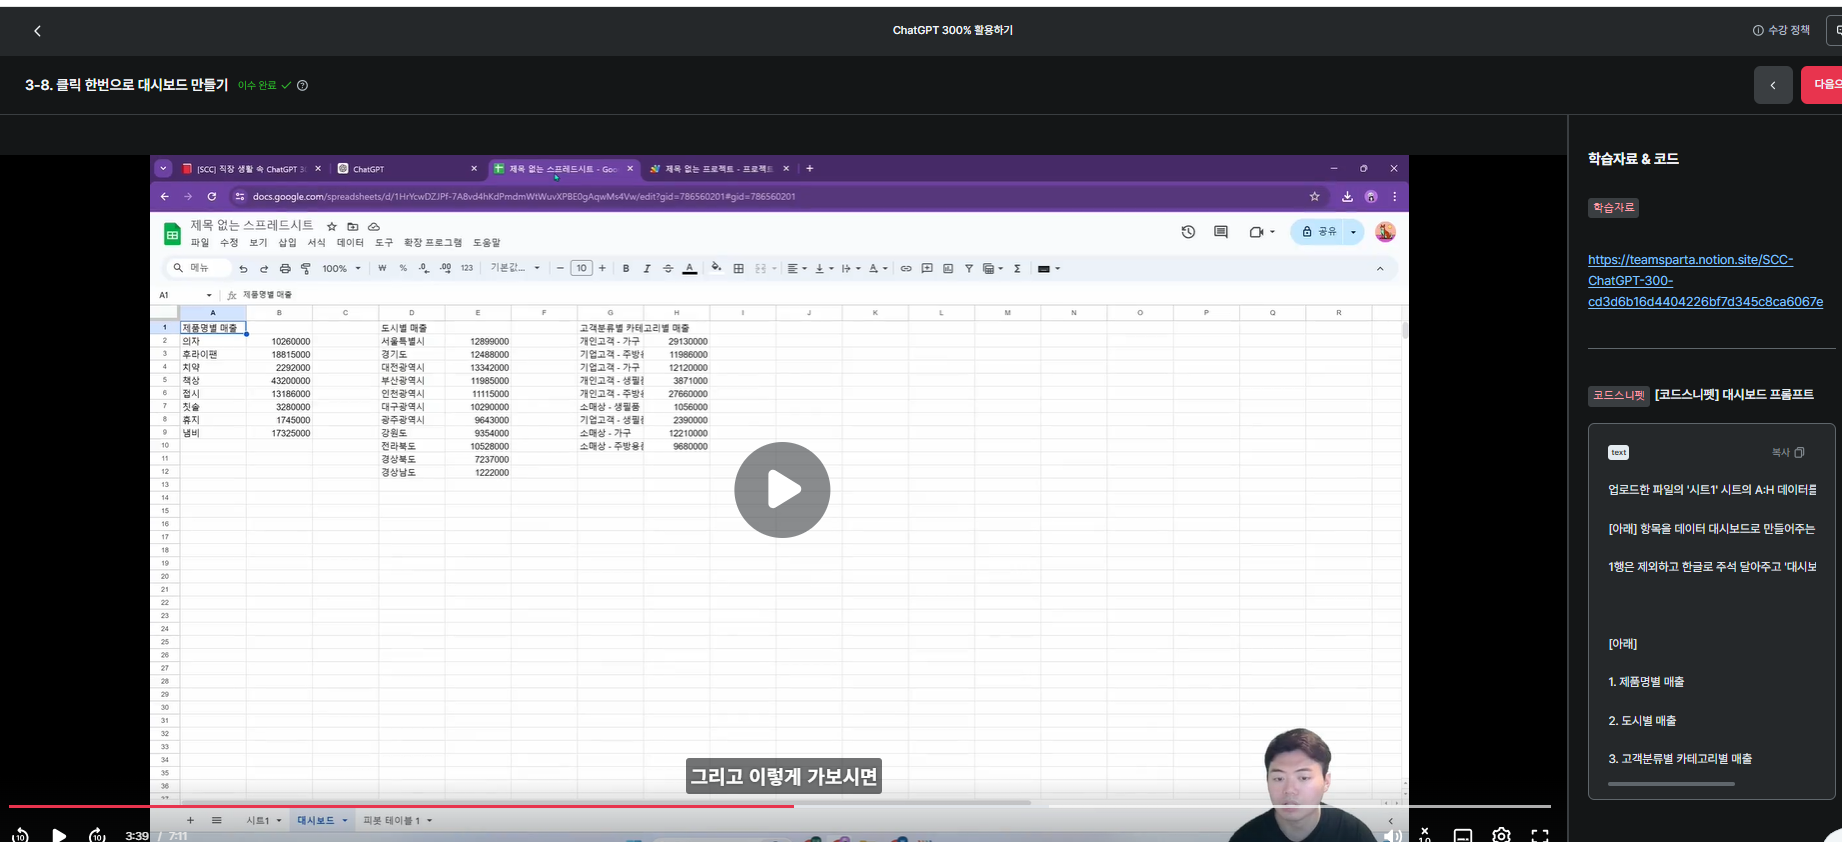
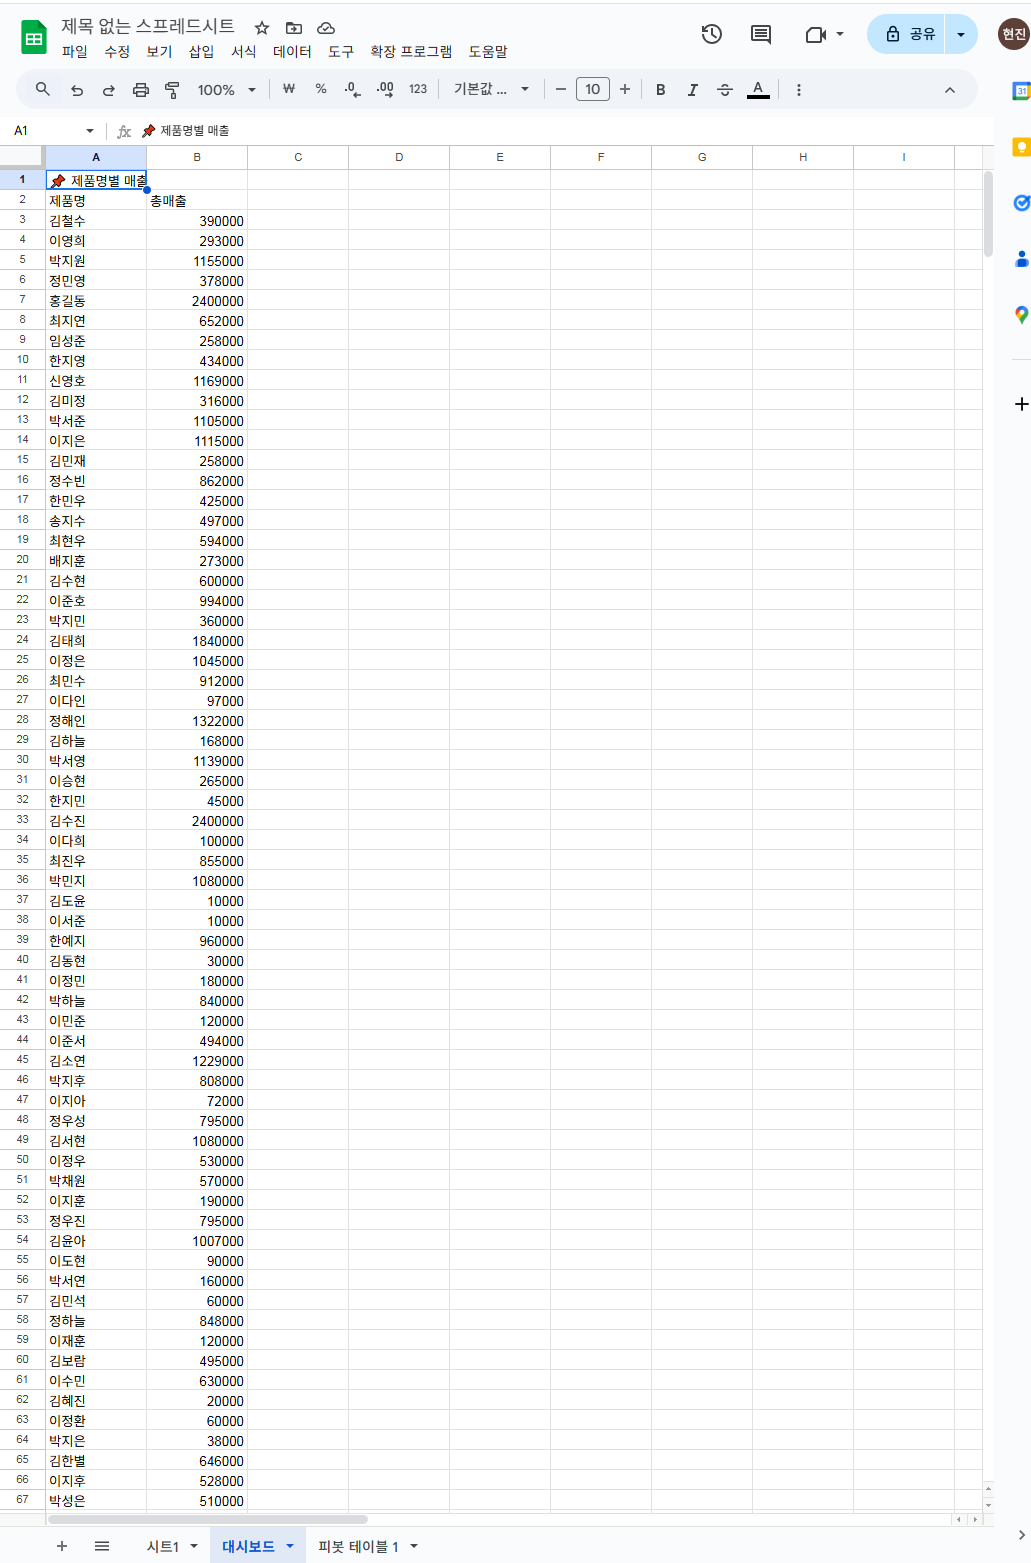
3-8. 클릭 한번으로 대시보드 만들기 [코드스니펫] 대시보드 프롬프트 복붙하여 실행시켜보니 강의내용과 다르게 나와서 난감하네요.
전체 화면 캡처
업로드한 파일의 '시트1' 시트의 A:H 데이터를 대시보드로 만들려고해 [아래] 항목을 데이터 대시보드로 만들어주는 구글 앱스크립트를 작성해줘 1행은 제외하고 한글로 주석 달아주고 '대시보드' 시트에 기록해줘 [아래] 1. 제품명별 매출 2. 도시별 매출 3. 고객분류별 카테고리별 매출
-------------
function createDashboardSummary() {
const ss = SpreadsheetApp.getActiveSpreadsheet();
const sourceSheet = ss.getSheetByName("시트1");
// 기존 대시보드 시트가 있으면 삭제
const oldDashboard = ss.getSheetByName("대시보드");
if (oldDashboard) ss.deleteSheet(oldDashboard);
// 새 시트 생성
const dashboard = ss.insertSheet("대시보드");
// 시트1의 A:H 데이터 (헤더 제외)
const data = sourceSheet.getRange("A2:H" + sourceSheet.getLastRow()).getValues();
// 컬럼 위치:
// 제품명 (C열 = index 2), 카테고리 (D열 = 3), 도시 (E열 = 4), 고객분류 (F열 = 5), 매출 (G열 = 6)
// ========== 1. 제품명별 매출 ==========
const productSales = {};
data.forEach(row => {
const product = row[2]; // C열: 제품명
const sales = parseFloat(row[6]) || 0; // G열: 매출
if (!productSales[product]) productSales[product] = 0;
productSales[product] += sales;
});
// 대시보드에 제품명별 매출 작성
dashboard.getRange("A1").setValue("📌 제품명별 매출");
dashboard.getRange("A2").setValue("제품명");
dashboard.getRange("B2").setValue("총매출");
let rowIndex = 3;
for (let key in productSales) {
dashboard.getRange("A" + rowIndex).setValue(key);
dashboard.getRange("B" + rowIndex).setValue(productSales[key]);
rowIndex++;
}
// ========== 2. 도시별 매출 ==========
const citySales = {};
data.forEach(row => {
const city = row[4]; // E열: 도시
const sales = parseFloat(row[6]) || 0;
if (!citySales[city]) citySales[city] = 0;
citySales[city] += sales;
});
const cityStartRow = rowIndex + 2;
dashboard.getRange("A" + cityStartRow).setValue("📌 도시별 매출");
dashboard.getRange("A" + (cityStartRow + 1)).setValue("도시");
dashboard.getRange("B" + (cityStartRow + 1)).setValue("총매출");
rowIndex = cityStartRow + 2;
for (let key in citySales) {
dashboard.getRange("A" + rowIndex).setValue(key);
dashboard.getRange("B" + rowIndex).setValue(citySales[key]);
rowIndex++;
}
// ========== 3. 고객분류 > 카테고리별 매출 ==========
const customerCategorySales = {};
data.forEach(row => {
const customer = row[5]; // F열: 고객분류
const category = row[3]; // D열: 카테고리
const key = `${customer} > ${category}`;
const sales = parseFloat(row[6]) || 0;
if (!customerCategorySales[key]) customerCategorySales[key] = 0;
customerCategorySales[key] += sales;
});
const comboStartRow = rowIndex + 2;
dashboard.getRange("A" + comboStartRow).setValue("📌 고객분류별 > 카테고리별 매출");
dashboard.getRange("A" + (comboStartRow + 1)).setValue("고객분류 > 카테고리");
dashboard.getRange("B" + (comboStartRow + 1)).setValue("총매출");
rowIndex = comboStartRow + 2;
for (let key in customerCategorySales) {
dashboard.getRange("A" + rowIndex).setValue(key);
dashboard.getRange("B" + rowIndex).setValue(customerCategorySales[key]);
rowIndex++;
}
SpreadsheetApp.flush(); // 시트 반영
}


