


* 겪고 있는 문제 상황을 최대한 자세하게 작성해주세요.
* 문제 해결을 위해 어떤 시도를 해보았는지 구체적으로 함께 알려주세요.
안녕하세요.
숙제피드백처럼 아래와 같이 수정했는데 계속 color가 포함된 열이름이 아니라는 오류만 반복됩니다.
그리고 df[df["건물용도"] == purpose].iloc[:,1:] 도 잘 이해가 안되고 그 밑에
x=x,
y=y,
color=color,
title=f"2008~2023 {purpose} 자치구별 중앙값 {y}"
)
도 왜이렇게 쓰는지 이해가 안갑니다.
x=x y=y 왜 이렇게 똑같은 문자를 = 양쪽에 사용하는지요.
확인 부탁드립니다.
purpose = purpose_gu_year_df['건물용도'].unique()
def lineplot_by_purpose(df, x, y, color, purpose):
return lineplot(
df[df["건물용도"] == purpose].iloc[:,1:],
x=x,
y=y,
color=color,
title=f"2008~2023 {purpose} 자치구별 중앙값 {y}"
)
for p in purpose:
fig = lineplot_by_purpose(
purpose_gu_year_df,
'계약연도',
'금액(억)',
'자치구명',
purpose=p,
)
fig.show()
---------------------------------------------------------------------------
ValueError                                Traceback (most recent call last)
<ipython-input-24-85a8099af7a9> in <cell line: 1>()
      1 for p in purpose:
----> 2     fig = lineplot_by_purpose(
      3         purpose_gu_year_df,
      4         '계약연도',
      5         '금액(억)',
5 frames
/usr/local/lib/python3.10/dist-packages/plotly/express/_core.py in process_args_into_dataframe(args, wide_mode, var_name, value_name)
   1206                         if argument == "index":
   1207                             err_msg += "\n To use the index, pass it in directly as `df.index`."
-> 1208                         raise ValueError(err_msg)
   1209                 elif length and len(df_input[argument]) != length:
   1210                     raise ValueError(
ValueError: Value of 'color' is not the name of a column in 'data_frame'. Expected one of ['계약연도', '건물용도', '금액(억)'] but received: 자치구명
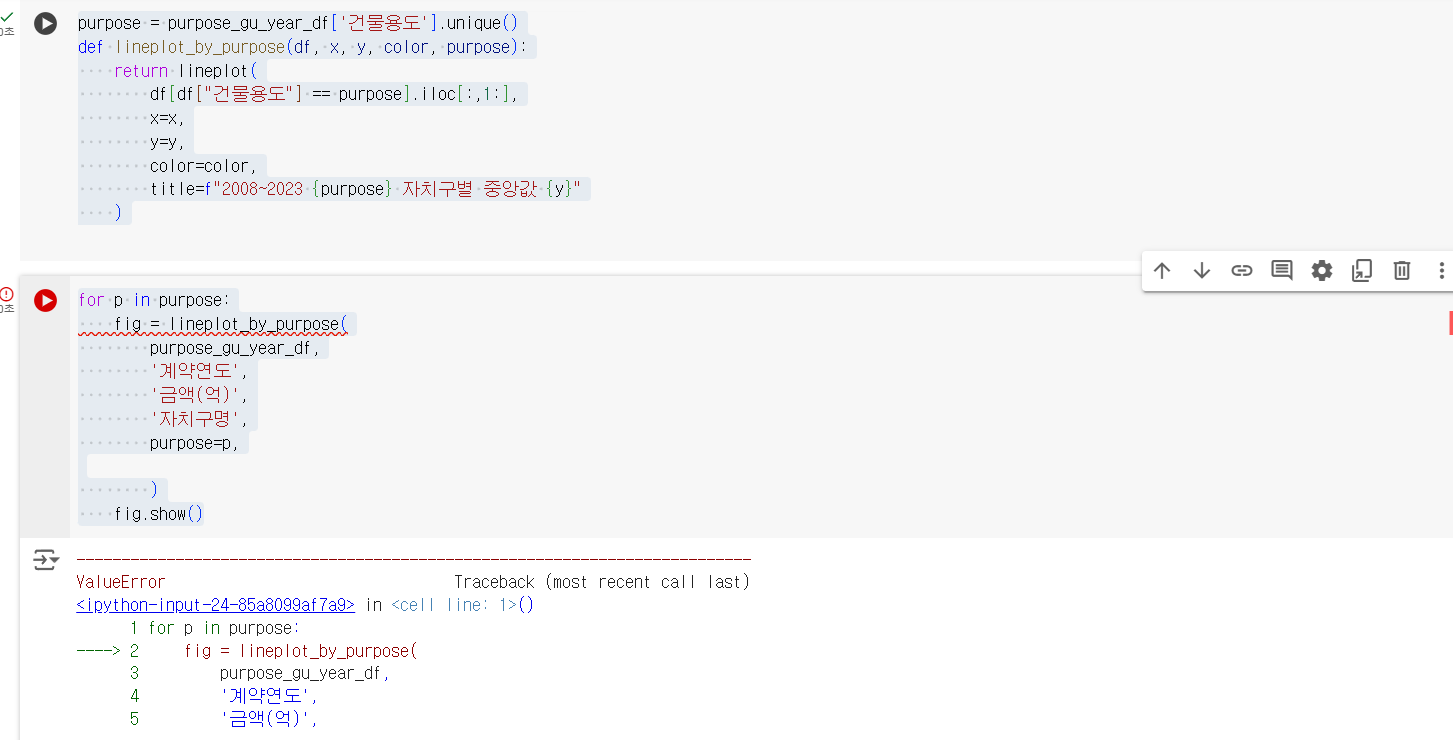
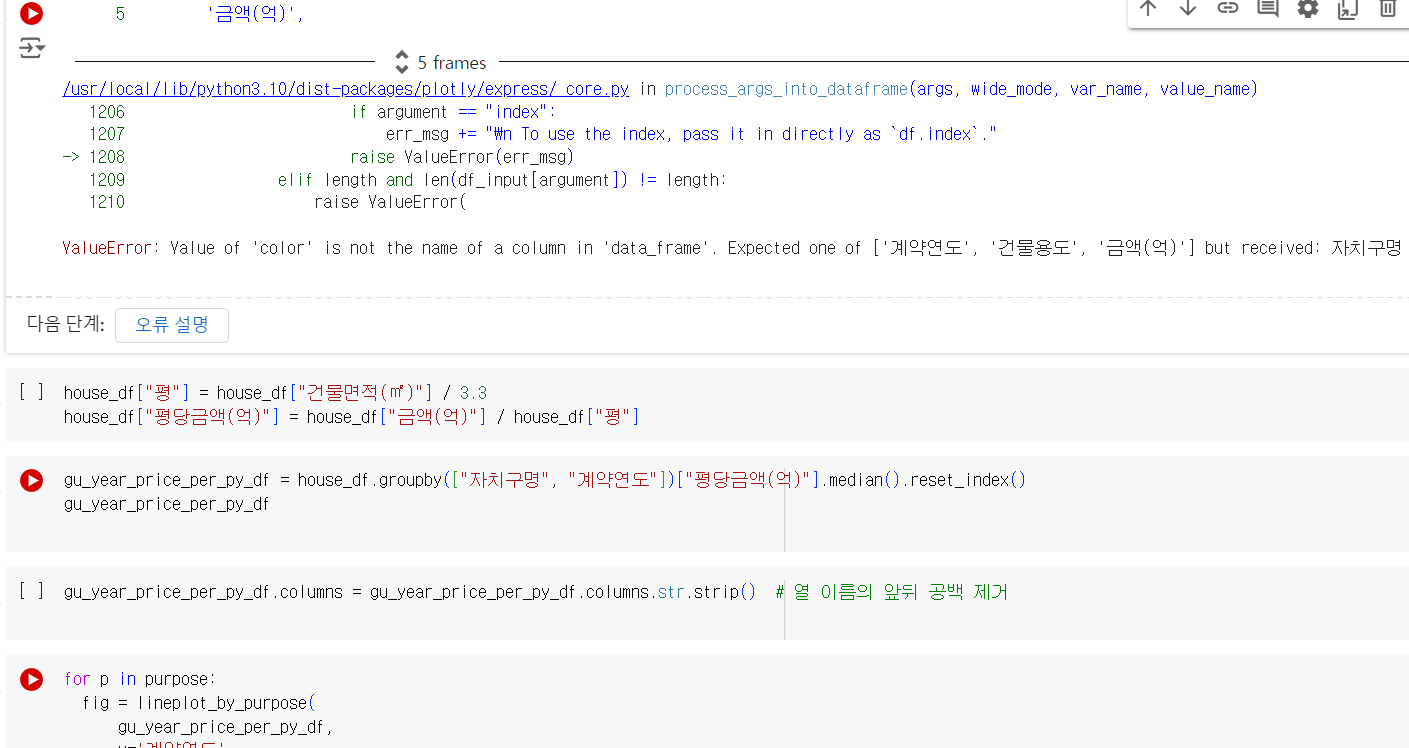
작성한 코드 및 에러 메세지
purpose = purpose_gu_year_df['건물용도'].unique()
def lineplot_by_purpose(df, x, y, color, purpose):
return lineplot(
df[df["건물용도"] == purpose].iloc[:,1:],
x=x,
y=y,
color=color,
title=f"2008~2023 {purpose} 자치구별 중앙값 {y}"
)
for p in purpose:
fig = lineplot_by_purpose(
purpose_gu_year_df,
'계약연도',
'금액(억)',
'자치구명',
purpose=p,
)
fig.show()오류 발생 시, 작성한 코드 전체와 에러 메시지를 첨부해 주세요.
Tip 1) </> 아이콘을 눌러 코드박스를 만들어 보세요.
Tip 2) Ctrl+A(맥의 경우 Command+A) 단축키로 코드를 한 번에 선택할 수 있어요!


