커뮤니티

포인트
쿠폰
내 강의실
국비 신청 내역
증명서
계정
로그아웃
학습 질문
개발 일지
나의 활동
답변 완료
숙제에서, x_list를 따로 정의하지 않고 바로 plt.bar 안에 student_discounted.index를 넣었더니 그래프 출력이 안 되는데, 왜 이런 걸까요?
undefined주차


곽*현
댓글
12
・
추천
0
・
조회수
35
조회수
35
답변 완료
* 겪고 있는 문제 상황을 최대한 자세하게 작성해주세요.
* 문제 해결을 위해 어떤 시도를 해보았는지 구체적으로 함께 알려주세요.
숙제에서, x_list를 따로 정의하지 않고 바로 plt.bar 안에 student_discounted.index를 넣었더니 그래프 출력이 안 되는데, 왜 이런 걸까요?
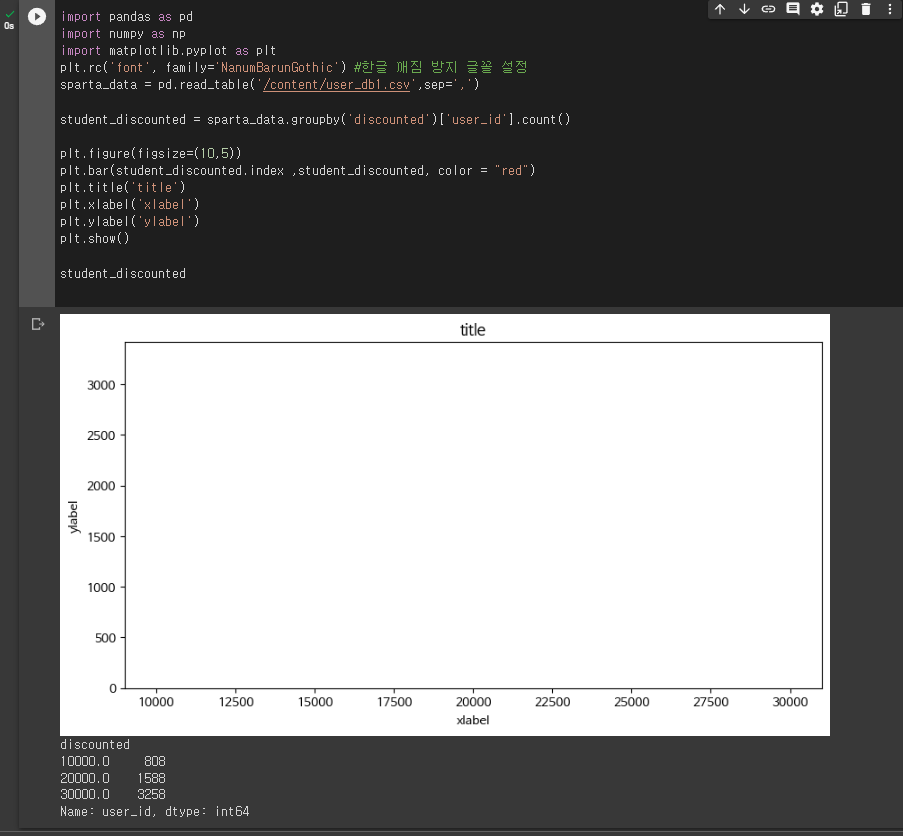
import pandas as pd
import numpy as np
import matplotlib.pyplot as plt
plt.rc('font', family='NanumBarunGothic') #한글 깨짐 방지 글꼴 설정
sparta_data = pd.read_table('/content/user_db1.csv',sep=',')


student_discounted = sparta_data.groupby('discounted')['user_id'].count()


plt.figure(figsize=(10,5))
plt.bar(student_discounted.index ,student_discounted, color = "red")
plt.title('title')
plt.xlabel('xlabel')
plt.ylabel('ylabel')
plt.show()


student_discounted


댓글 알림
