


그래프 타이틀이나 레이블에 한글이 들어가면 모두 오류가 나네요... 해결 방법이 있을까요?
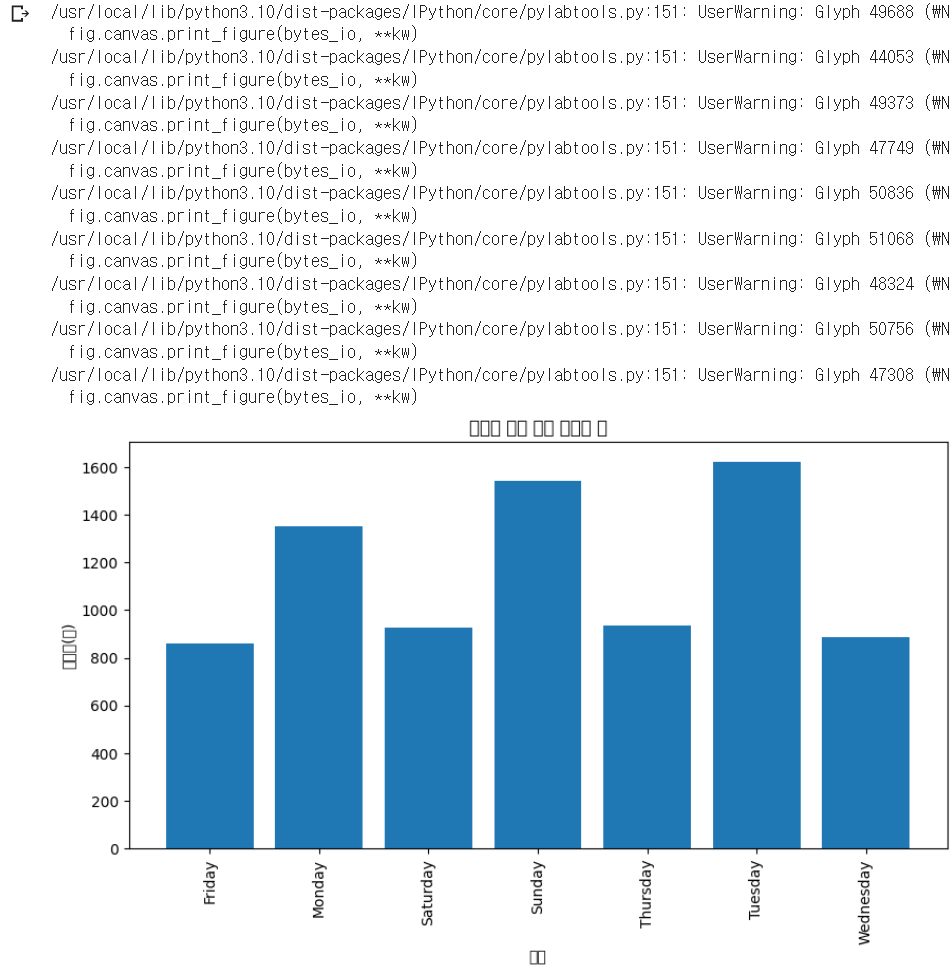
작성한 코드 및 에러 메세지
import matplotlib.pyplot as plt
import numpy as np


#그래프 사이즈
plt.figure(figsize=(10,5))


#그래프 x축 y축
plt.bar(weekdata.index, weekdata)


#그래프 명
plt.title('요일별 수강 완료 수강생 수')


#그래프 x축 레이블
plt.xlabel('요일')


#그래프 y축 레이블
plt.ylabel('수강생(명)')


#x축 레이블을 90도로 변환
plt.xticks(rotation=90)


#그래프 출력
plt.show()
/usr/local/lib/python3.10/dist-packages/IPython/core/pylabtools.py:151: UserWarning: Glyph 49688 (\N{HANGUL SYLLABLE SU}) missing from current font.
fig.canvas.print_figure(bytes_io, **kw)
/usr/local/lib/python3.10/dist-packages/IPython/core/pylabtools.py:151: UserWarning: Glyph 44053 (\N{HANGUL SYLLABLE GANG}) missing from current font.
fig.canvas.print_figure(bytes_io, **kw)
/usr/local/lib/python3.10/dist-packages/IPython/core/pylabtools.py:151: UserWarning: Glyph 49373 (\N{HANGUL SYLLABLE SAENG}) missing from current font.
fig.canvas.print_figure(bytes_io, **kw)
/usr/local/lib/python3.10/dist-packages/IPython/core/pylabtools.py:151: UserWarning: Glyph 47749 (\N{HANGUL SYLLABLE MYEONG}) missing from current font.
fig.canvas.print_figure(bytes_io, **kw)
/usr/local/lib/python3.10/dist-packages/IPython/core/pylabtools.py:151: UserWarning: Glyph 50836 (\N{HANGUL SYLLABLE YO}) missing from current font.
fig.canvas.print_figure(bytes_io, **kw)
/usr/local/lib/python3.10/dist-packages/IPython/core/pylabtools.py:151: UserWarning: Glyph 51068 (\N{HANGUL SYLLABLE IL}) missing from current font.
fig.canvas.print_figure(bytes_io, **kw)
/usr/local/lib/python3.10/dist-packages/IPython/core/pylabtools.py:151: UserWarning: Glyph 48324 (\N{HANGUL SYLLABLE BYEOL}) missing from current font.
fig.canvas.print_figure(bytes_io, **kw)
/usr/local/lib/python3.10/dist-packages/IPython/core/pylabtools.py:151: UserWarning: Glyph 50756 (\N{HANGUL SYLLABLE WAN}) missing from current font.
fig.canvas.print_figure(bytes_io, **kw)
/usr/local/lib/python3.10/dist-packages/IPython/core/pylabtools.py:151: UserWarning: Glyph 47308 (\N{HANGUL SYLLABLE RYO}) missing from current font.
fig.canvas.print_figure(bytes_io, **kw)


