커뮤니티

포인트
쿠폰
내 강의실
국비 신청 내역
증명서
계정
로그아웃
학습 질문
개발 일지
나의 활동
답변 완료
나이대와 생존율 관계 그래프 그리기가 안돼요
undefined주차


정*수
댓글
1
・
추천
0
・
조회수
5
조회수
5
답변 완료
* 겪고 있는 문제 상황을 최대한 자세하게 작성해주세요.
* 문제 해결을 위해 어떤 시도를 해보았는지 구체적으로 함께 알려주세요.
수업따라하면 서 쭉쭉 잘 됐는데
#그래프 크기 설정 plt.figure(figsize=(14,5)) # 바 그래프 그리기 (x축 = Age_cat, y축 = Survived) sns.barplot('Age_cat','Survived',data=titanic) # 그래프 나타내기 plt.show()
이 코드 넣고 에러가 떠요
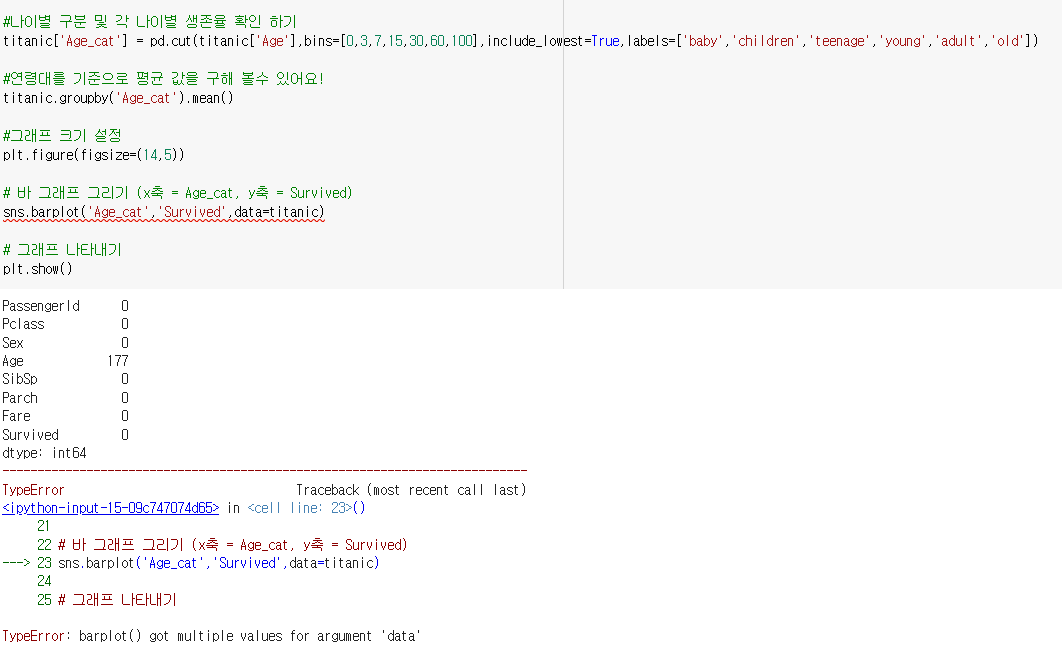
TypeError                                 Traceback (most recent call last)
<ipython-input-17-09c747074d65> in <cell line: 23>()
     21
     22 # 바 그래프 그리기 (x축 = Age_cat, y축 = Survived)
---> 23 sns.barplot('Age_cat','Survived',data=titanic)
     24
     25 # 그래프 나타내기

TypeError: barplot() got multiple values for argument 'data'


댓글 알림
