


* 겪고 있는 문제 상황을 최대한 자세하게 작성해주세요.
* 문제 해결을 위해 어떤 시도를 해보았는지 구체적으로 함께 알려주세요.
plt.legend 명령문을 사용해도 꺾은선 그래프에 범례가 생기지 않습니다.
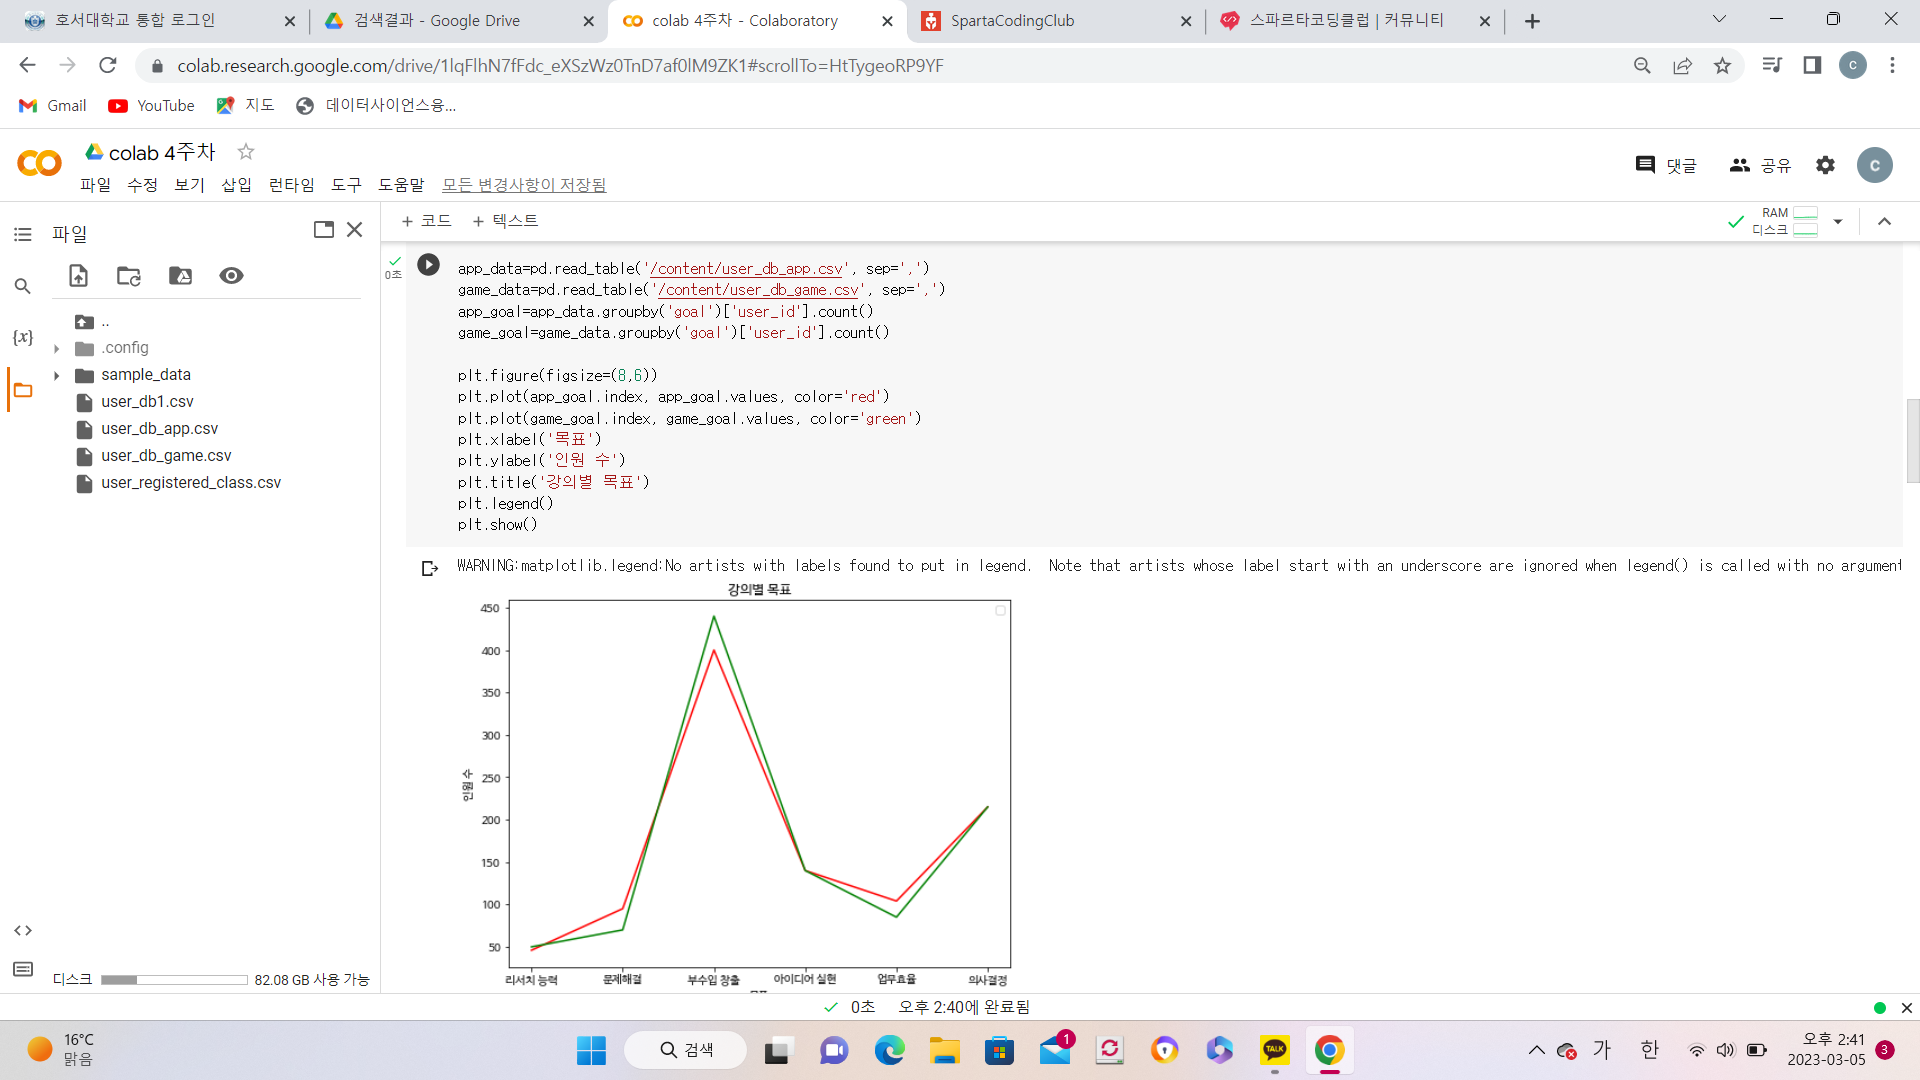
작성한 코드 및 에러 메세지
import pandas as pd
import numpy as np
import matplotlib.pyplot as plt
plt.rc('font', family='NanumBarunGothic')
app_data=pd.read_table('/content/user_db_app.csv', sep=',')
game_data=pd.read_table('/content/user_db_game.csv', sep=',')
app_goal=app_data.groupby('goal')['user_id'].count()
game_goal=game_data.groupby('goal')['user_id'].count()
plt.figure(figsize=(8,6))
plt.plot(app_goal.index, app_goal.values, color='red')
plt.plot(game_goal.index, game_goal.values, color='green')
plt.xlabel('목표')
plt.ylabel('인원 수')
plt.title('강의별 목표')
plt.legend()
plt.show()
WARNING:matplotlib.legend:No artists with labels found to put in legend. Note that artists whose label start with an underscore are ignored when legend() is called with no argument.
오류 발생 시, 작성한 코드 전체와 에러 메시지를 첨부해 주세요.
Tip 1) </> 아이콘을 눌러 코드박스를 만들어 보세요.
Tip 2) Ctrl+A(맥의 경우 Command+A) 단축키로 코드를 한 번에 선택할 수 있어요!


